The Set Up
This post is number three in a series of five or six posts related to Product Portfolio Planning (PPP). Once you have the market risks identified and scored [from the previous blog post] you must then set a revenue goal. This post will deal with revenue goal setting and R&D budget setting. These three elements make up the end game for your product portfolio plan. As a reminder the goal of the PPP is to hit target revenue, at target cost levels with risk that is harmonized with your risk tolerance profile.
PPP Goals
The source of these Product Portfolio Goals (PPG) should come from a strategic plan (SP) that matches the time frame of the Product Portfolio Plan. If there isn’t a SP, then the source of your goals needs to be the CEO, President or VP of Gobal Marketing.
For larger corporations there will most certainly be either a SP or a policy intention. Something to the effect that by 20XX, XX% of our revenue will be provided by products launched within the last 5 years. Not too difficult to get to a number.
Illustration
So lets say that your company launched their first product in 2000 and in it’s first year it produced $20 million in sales. You had a steady release of new products and achieved $500 million by 2005. You had nothing in the R&D pipeline and there were significant shifts occuring in the market with innovation, competition and consolidation. Your CEO announces at a staff meeting that you need a continous flow of new product introductions such that you achieve $750 million in profitable revenue by 2013.
You get back to your desk and do some quick calculations and prod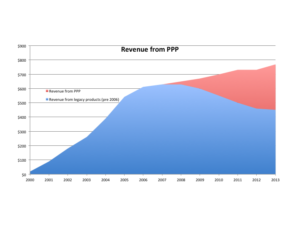 uce this chart.
You realize that you need $250 million dollars of revenue output from this new PPP within the next 7 years. It takes between 2-5 years to commercialize a product.
In that same staff meeting the CEO indicated that he was willing to invest more than the industry average to achieve that goal. You know from a industry survey and quick review of the competitors Shareholder reports that, on average, companies invest 7-10% on R&D. Taking your CEO at his word it looks like you would have 12% of revenue to invest each year. As sales continue to grow the R&D budget would grow in real dollars as well.
You are feeling a little better now. You know the revenue goal, you know the typical turn time for product development (based on the performance of the nine products that you have launched so far).
But Which Investments?
Where do you place the $60M worth of R&D dollars to guarentee that you reach $750M in revenue? There are two approaches to determine this list of development projects. Top-down or Bottom-up. I suppose there is a third, which is a combination of the two.
For me, an evironmental scan of your market is in order. As a quick starting point a Monte Carlo approach to determine the risks and opportunities in the market (as described in the most recent post). If there is a recent strategic plan (SP) document you could start there to discover the growing segments and review the SWOT anaylisis. If there isn’t a SP, start from scratch.
In parrallel, you take a look at what is being worked on in R&D currently. You discover that there are currently 18 projects under development. It appears that in the absence of an agreed to PPP every pet project has emerged and been funded. This is natural and is exactly why you need a portfolio plan.
So you ask yourself how many projects should you have?
You do a bit more analyis of the current performance of your products and project that same level of performance forward and you see from your chart that 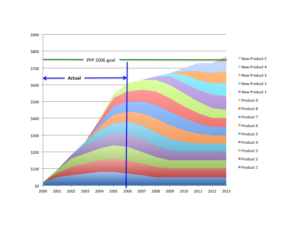 you need around five. You feel that you have a good start but realize that you are going to need a group effort to actual develop the plan. You report out your findings to the CEO and are asked to share your finding with the general staff next week. You do. The CEO then announces that you are now in charge of developing the PPP and that everyone is expected to provide their full cooperation.
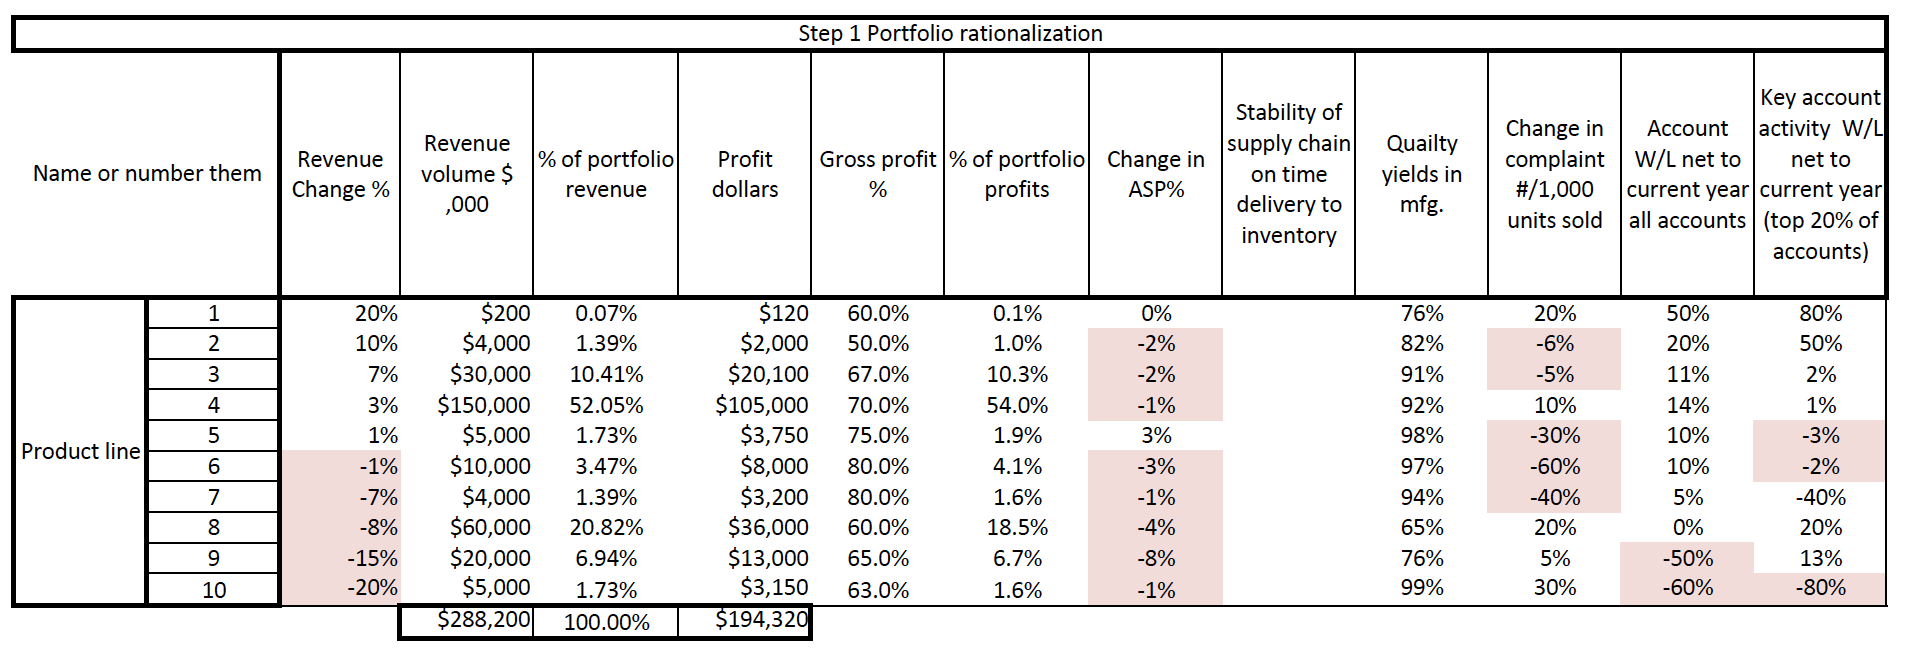
The following week you get your team together, R&D, NBD, Finance, Marketing and Operations. The big realization that comes out of the organizing meeting are three very fundamental issues. First, that the market has been shifting for a long time, very slowly and now that you stop to look at the impact of those changes they look huge. Secondly, that R&D does not have a standardized method for comparing projects. If you are going to make a decision about which current and future projects to fund, it is critical that you have a very consistent way for comparing them. Third, that none of the 18 projects are fully funded or are driving toward a commercialization date.
So NBD and marketing head off to get a handle on the market and the market trends. R&D, finance and Ops head off to develop a method to compare projects (investments). You have all agreed to comeback in two-weeks with a status report. Meantime you have one of your Product Directors working on the market Risk assessment.
Two weeks later you gather again and there is good progress. R&D, Finance and Ops have come up with a model that scores cost, time, head count, technical risk, and capability. What they have not yet factored in are revenue potential, profitability, market acceptance risk and commercialization costs.
|
R&D variables
|
Market variable
|
| · Utility delivered to end user
· Development cost
· Time to regualtory clearance
· Head count requirements
· Technical capabilities
· Technical risk |
· Un-met market need
· Revenue potential
· Profitabilty (price target)
· Market acceptance
· Commercialization costs
· Time to commercialize |
| Discount factor due to combined confidence of success |
Marketing and NBD report back that they have priced out several market research projects that would provide all the information they need. The price and lead time seem reasonable for the need, however there is no allocated budget to cover the $2M dollars and the six-month time line seems too long for the sense of urgency the CEO has around this project.
You assign a second Product Director to work with R&D and Finance to round out the balance of the project assessment method. You and NDB develop a survey (discussion guide) and make appointments with ten key opinion leaders, luckly 8 are attending a conference over the week-end and you will be there. While at the conference you speak with a total of 20 physicians and have what you think is a pretty good handle on the market needs.
Your next meeting with the extended team is a half day working session. Everyone reports out their findings. You now have a method for comparing projects, you have a feel for the market trends, you have a risk map that was developed [which your CEO, and all geographic experts, internal experts and two external market expert have scored].
During the half-day session you develop a table that organizes all the relevant information.
| Risk or Trend |
Source |
Importance / Size |
Project |
Outcome |
|
|
|
|
|
|
|
|
|
|
|
|
|
|
|
This chart is critical. It will provide a narrative surrounding the “as is condition” of your portfolio. The format and style is less important that the content. For me I would use 11×17 paper in profile.
What should become obvious from this charting process is the list of projects that are ongoing in R&D that have no bearing on the market reality that you are dealing with. Also, where the large holes are that need to be filled.
The Next Steps
- Envision projects that would fill the holes
- Rescore the Market Risk Assessment based on these new projects
- Re-score the projects using the consistent methodology
- Rank the projects using 1) discounted revenue potential, 2) pay back period 3) positive impact to market risk reduction. You can also use NPV or IRR calculations.
Chart the Rankings by Project
|
Project number
|
Project name |
Expected revenue |
Payback period |
Risk reduction impact |
Combined rank scores |
Combined rankings |
|
1
|
|
2
|
3
|
1 |
6 |
1
|
|
2
|
|
3 |
5 |
4 |
12 |
2
|
|
3
|
|
5 |
7 |
6 |
18 |
3
|
|
4
|
|
1 |
2 |
3 |
6 |
1
|
| n |
|
|
|
|
|
|
Prioritize the list of projects by combined rankings and then pour the R&D budget over the top letting it drip down until it is gone.
Hint: Never partially fund a project. Dry pancakes are just not satisfying.
More about Product Portfolio Planning in future blog posts.
Make sure you are signed up to receive personal notifications for future post relating to this subject.
“Experience is what you get, right after you need it most.”
Make it a great day,
Tim Walker
Tim Walker is the Principal consultant for The Experia Group. A small consulting firm that specializes in providing experience and expertise during critical device commercialization phases to increase the probability of success. www.theexperiagroup.com. Contact The Experia Group for a free 30-minute consultation to determine if 30-years of experience can contribute to your success.
© 2016, The Experia Group, LLC


 Step 2- Build Your Model
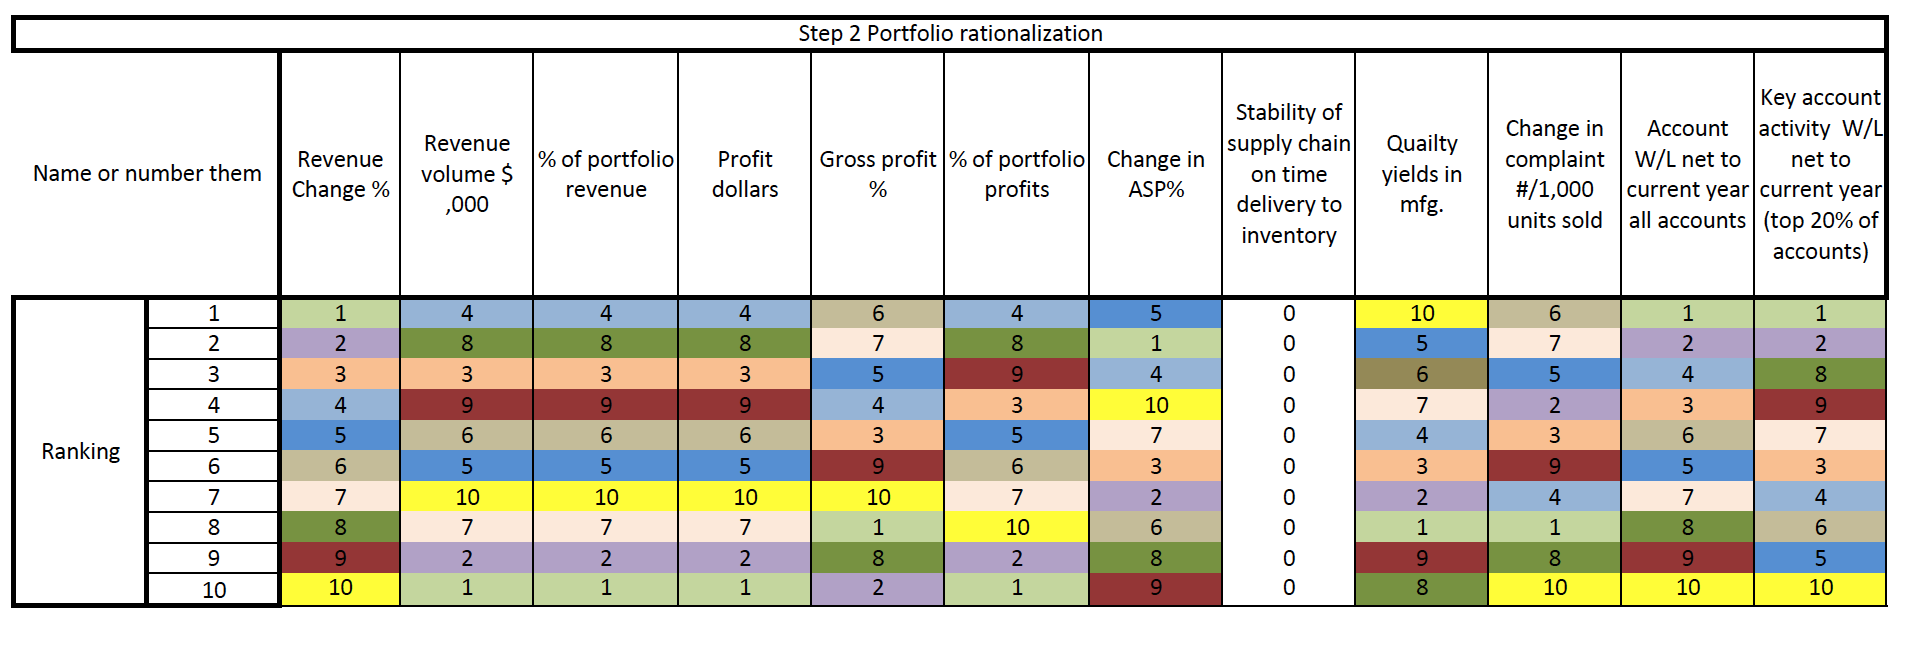 Step 3- Analyze the Rankings for Obvious Ins and Outs
 Follow this simple three-step process to rationalize your product line and defend your position. Keep the grid/worksheet with you in every meeting and you will be able to see at a glance where you are going next.