Tag Archives: Annual Product Performance Review

Product Line Rationalization for Medical Devices

The Set Up

It has been some time since I actually performed a Legacy Product Line Rationalization. Two calls this week have prompted me to create this post. This is how I think about it.

As a Product Manager, one of the most necessary and potentially difficult tasks is to rationalize your portfolio product lines for an exit, maintain or invest strategy. If you review your product line performance on an annual basis, see AARP post, you will find that you have most of the data and insights you need.

The Goal of the Review

The goal is to rationalize your current portfolio based on the previous performance changes year over year. You pretty much have 3 options although they can be thought of as on a scale.

  • Maintain
  • Invest
  • Divest

This review will point you toward actions that are needed in support of each product line. Your annual action plan can be driven by your findings.

“The Key is to be intentional about your product line.”

How do you do the review?

Step 1 – Collect and Organize Your Data

Determine a method for objectively determining how well your product lines are performing. Elements that you should consider including in your assessment or scoring tools are:

  • The volume of revenue, ranking
  • Change in revenue
  • Gross profit dollars
  • Profitability
  • How ubiquitous the product is geographically
  • How stable is the supply chain
  • Quality yields
  • Number of customers won and lost this past year
  • What is the status of the treatment it is used on
  • Of those customers who are buying, where do they stack up on your best customer rankings list
  • Does it fit in the future strategic plan or will it become an orphan

The examples used here are designed to demonstrate a complex and murky review. Sometimes the answers pop off the page once you have organized all of the relevant data for your portfolio.

Step 2- Build Your Model

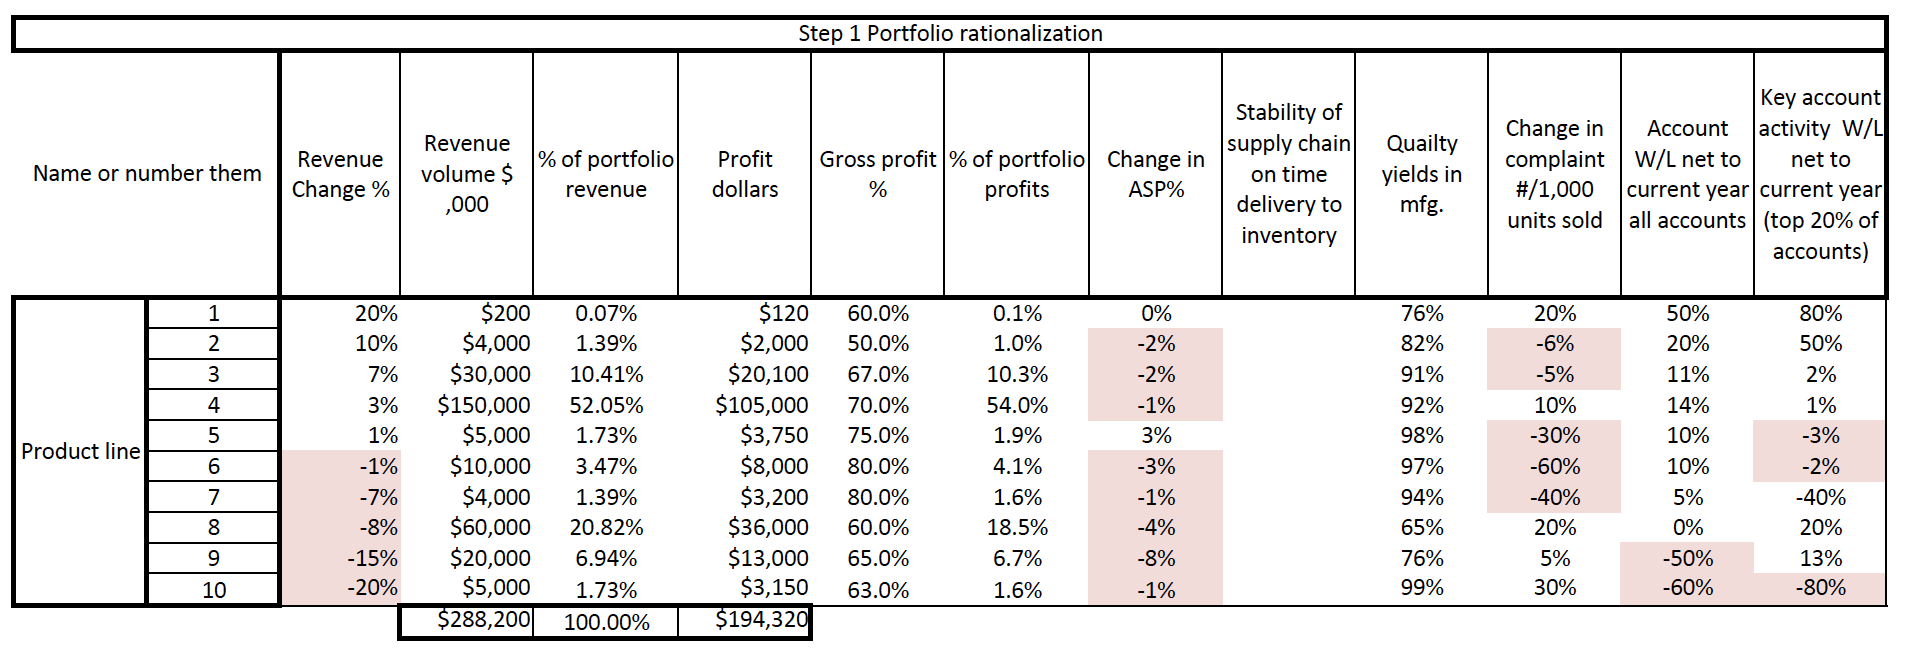
There are two aspects to this step. First, collect the data and rank each product line by element. Secondly, rank them all as a portfolio.   The first step is fairly mechanical. The second is where the lines are compared by rankings.

So if you have 10 product lines your spreadsheet would look like the one shown below.

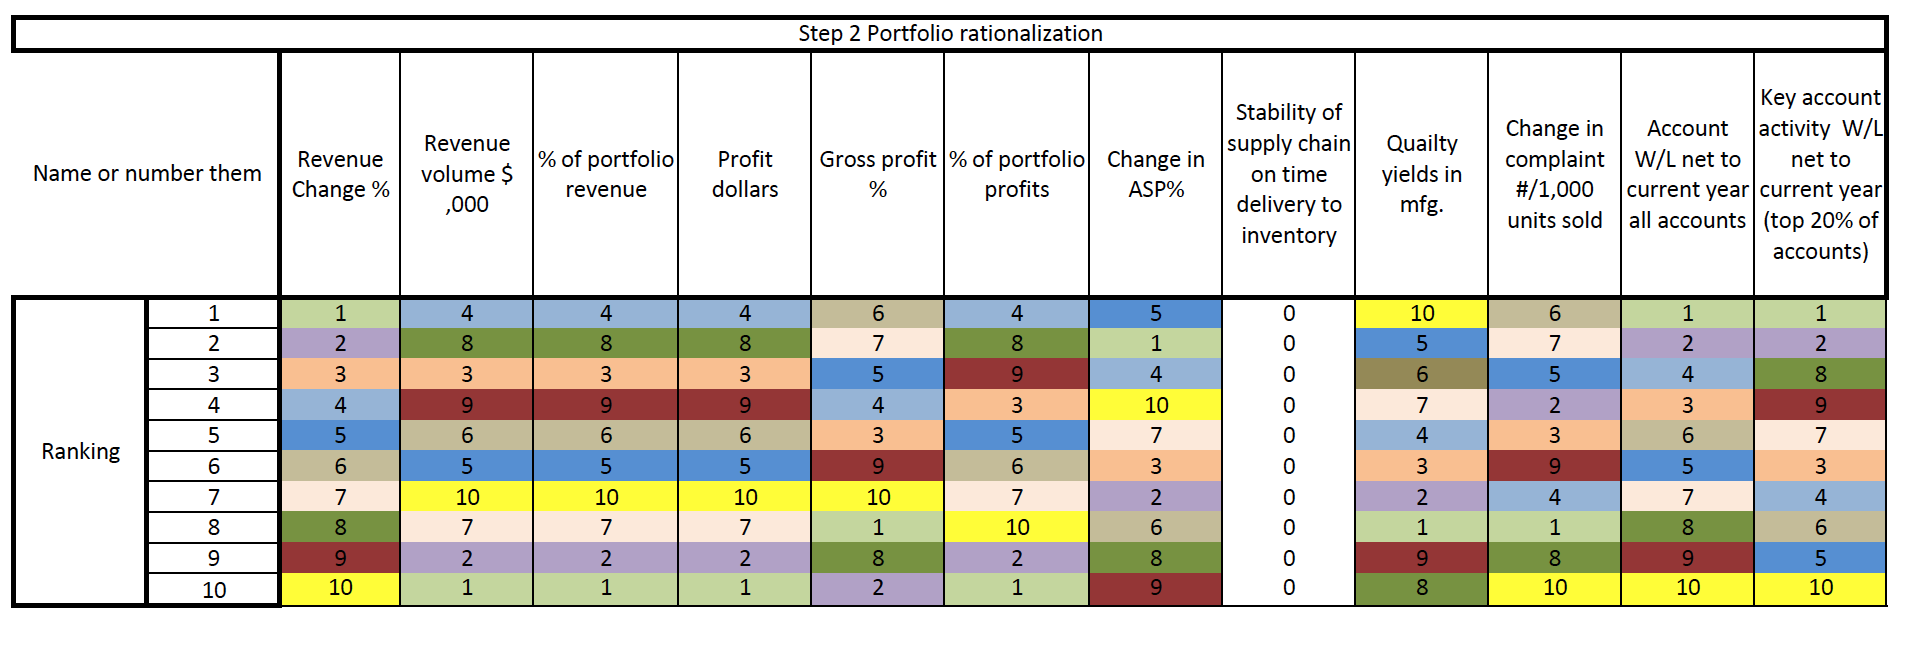
Step 3- Analyze the Rankings for Obvious Ins and Outs

  • Product line 1 is new, so it is IN
  • Product line 2 this needs a deeper dive, a better understanding of the market conditions are required.
  • Product line 3 solid performer so IN
  • Product line 4 solid performer so IN
  • Product line 5 solid performer with few key accounts so IN
  • Product line 6 solid performer so IN
  • Product line 7 this one needs a deeper dive. It is an average performer and seems like it will stay there for a while. If it still fits with your future vision for the portfolio it appears to be IN
  • Product line 8 too big to cut, needs some mfg. improvements
  • Product line 9 too big to cut, but needs a deeper dive so IN
  • Product line 10 this needs a deeper dive but may be too big to cut without a plan

So there are six product lines that should not be cut, 4 that need a bit deeper dive. Another element that we did not take into account was synergy between product lines. Sometimes you keep an underperforming product line to support a high performing one.

So if we plot our choices on to a Boston Consulting Group grid it can really give you a clear picture of your strategic position for each product line.

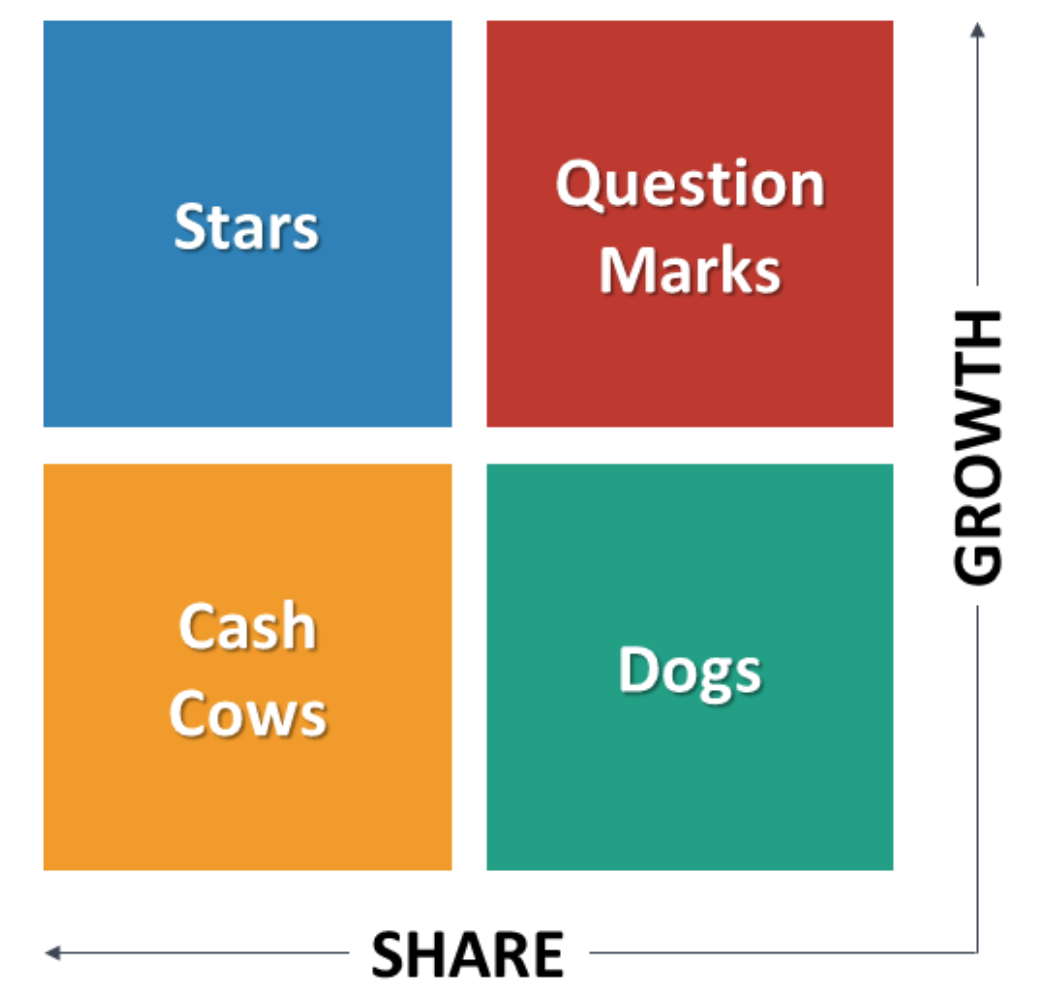
Combining this review with a go-forward plan you can use a matrix like this:

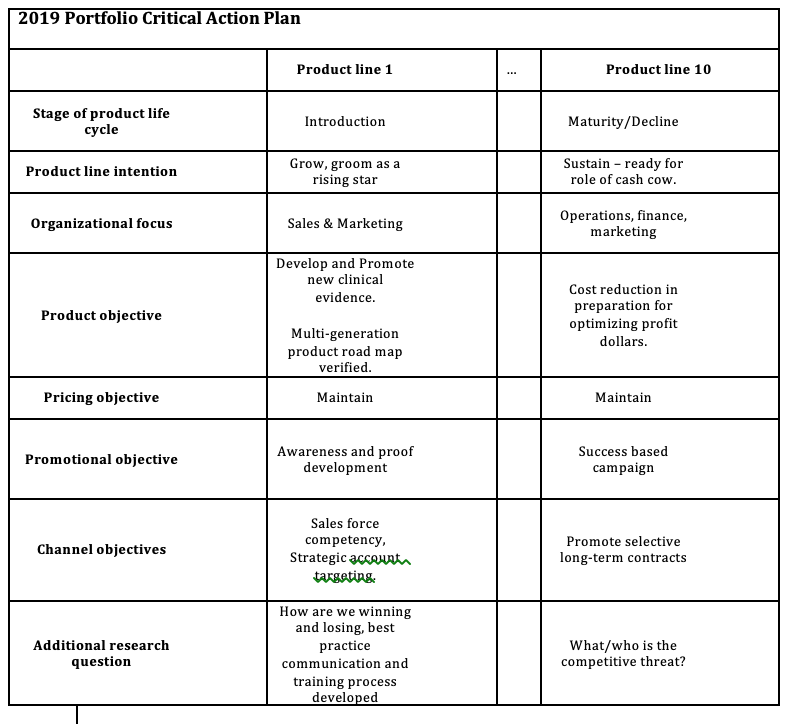
Follow this simple three-step process to rationalize your product line and defend your position.  Keep the grid/worksheet with you in every meeting and you will be able to see at a glance where you are going next.

It is ok to keep all of the product lines. It is unacceptable to not know why you want to keep them.

 “Experience is what you get, right after you need it most.”

 Make it a great day,

Tim Walker

Tim Walker is the Principal consultant for The Experia Group. A small consulting firm that specializes in providing experience and expertise during critical device commercialization phases to increase the probability of success. www.theexperiagroup.com. Contact The Experia Group for a free 30-minute consultation to determine if 30-years of experience can contribute to your success.

© 2019, The Experia Group, LLC

New Years Action Item for Product Managers: Perform an Annual Product Performance Review.

The Set Up

Following my own advice, I perform a year-end Annual Product Performance Review (APPR) which revealed some startling results.   Even after 30 years of managing medical device product lines my APPR revealed that I was spending a disproportionate amount of time working on non-business imperatives. To optimize your contribution to the company imperatives you need to periodically ask yourself, “How am I doing?”

It is easy to take advantage of opportunities and correct issues once you discover them, but if you never look, oh well.

So as obvious as the need for APPRs are, a number of my fellow marketers aren’t doing them. Why? They would go ballistic is their supervisors failed to do an annual performance appraisal on their own performance.

If you are a serious Product Manager you will have already set up monthly metrics to keep track of your new products (those less than 1 year old). Have you looked at your entire portfolio? No? I am willing to wager that if you do you will discover some amazing things that if acted upon will increase your portfolio performance in 2017.

Annual Product Performance Reviews

I call this maintenance activity an APPR. As a product manager we have to care for our product lines, particularly when they have been on the market for a while and the excitement of the launch has worn off. Spending one day a year, on each of your product lines is a minimal amount of your time invested that could prevent you from being shaken from a good night sleep by an overlooked issue. What kind of an issue? Quality shifts, pricing slip, share slip, new competitive entry, shifting sales force focus, slipping gross margins, resurgence, increasing complaint levels all these potential issues are leading indicators of critical times for your product line.

The APPR can be done anytime of year. At its core, is a year-over-year comparison of key metrics. The more years you have data for, the more likely you are to see a trend. It is good to partner with finance or IT the first time you conduct this type of analysis to make sure your data sources are complete and comparable. For some product lines a monthly review may be more appropriate.

Each APPR took a day and included a review of the following metrics

  • Units, total
  • Unit, mix
  • Average selling price (ASP)
  • ASP by mix
  • Complaint rate by type or category
  • Manufacturing yields
  • Gross margins (GM)
  • Revenue
  • Revenue distribution my geography
  • Revenue distribution by sales territory
  • Number of active accounts
  • Number of accounts that went inactive over the past 12 months
  • NEW! As accurately as you can estimate the amount of time you are spending on the various products in you portfolio.

These metrics are all loaded into a simple excel file, which automatically did the year-over-year trend comparison and some simple charting. The output was the APPR dashboard. Often this dashboard pointed towards areas that needed my attention and a bit of investigative work.

Today, I have created custom dashboards in salesforce.com that provides real time comparisons for new product launches, after one-year the dashboard changes to a periodic based trend analysis that has taken the place of the APPR dashboard. The important thing is to monitor the product lines you are responsible for and take nothing for granted. This is a good application of the, “productive paranoia” concept that Jim Collins discusses in his book, Great by Choice.

Career Building Opportunity

Once you have performed the review, packaging a “winners and losers” list is a great way to communicate to Sr. Management about the performance of their products (keep it simple – see example to the right). Everyone who doesn’t pay as close attention to your portfolio as you do would view this as a valuable tool. Now the challenge is that you are then compelled to act on the findings. Plan out 1-3 communications prior to publishing the list.

  1. Information
  2. Reflection
  3. Recommended action

Make sure your supervisor knows what you are doing and why.

If any one in your organization thinks that publishing a well-done Annual Product Performance Review is a bad thing; take a look at that and ask are the reasons political, personal, or other. You can’t change what you don’t measure.

“Experience is what you get, right after you need it most.”

Make it a great day,

Tim Walker

Tim Walker is the Principal consultant for The Experia Group. A small consulting firm that specializes in providing experience and expertise during critical device commercialization phases to increase the probability of success. www.theexperiagroup.com. Contact The Experia Group for a free 30-minute consultation to determine if 30-years of experience can contribute to your success.

© 2017, The Experia Group, LLC

Annual Product Performance Reviews for Medical Devices

Last night, at 1:34 AM, I was awoken by a chirping smoke alarm, indicating that it needed to have a new battery installed.

After finding the ladder and the new battery, quickly making the change and jumping back into bed, I started thinking about how that experience paralleled my work history.

The Story

In the early 80’s, as a young product manager I received a call from a production supervisor telling me that my biggest selling, most differentiated, oldest, product line was suffering from a 10% manufacturing yield and that I should get ready for significant, sustained back orders. I wasn’t paying attention to my all-star product; I had moved on to more creative work. This is when I instituted the, “Annual Product Performance Review” (APPR).

Discipline vs. Creativity

If I had only replaced all the smoke alarm batteries when I was supposed to, I would not have been shaken from a good night sleep. Discipline often escapes the truly creative person. As a product manager you need both discipline and creativity. One way to manage these sometimes opposing attributes is to schedule the maintenance activities surrounding a downtime in your otherwise busy calendar. Never schedule them during sales meeting prep time, never during trade show season, etc.

Annual Product Performance Reviews, the minimum

I call this maintenance activity an APPR. As a product manager we have to care for our product lines, particularly when they have been on the market for a while and the excitement of the launch has worn off. Spending one day a year, on each of your product lines is a minimal amount of your time invested that could prevent you from being shaken from a good night sleep by an overlooked issue. What kind of an issue? Quality shifts, pricing slip, share slip, new competitive entry, shifting sales force focus, slipping gross margins, resurgence, increasing complaint levels all these potential issues are leading indicators of critical times for your product line.

The APPR can be done anytime of year. At its core, is a year-over-year comparison of key metrics. The more years you have data for, the more likely you are to see a trend. It is good to partner with finance or IT the first time you conduct this type of analysis to make sure your data sources are complete and comparable. For some product lines a monthly review may be more appropriate.

Each APPR took a day and included a review of the following metrics:

  • Units, total
  • Unit, mix
  • Average selling price (ASP)
  • ASP by mix
  • Complaint rate by type or category
  • Manufacturing yields
  • Gross margins (GM)
  • Revenue
  • Revenue distribution my geography
  • Revenue distribution by sales territory
  • Number of active accounts
  • Number of accounts that went inactive over the past 12 months

These metrics are all loaded into a simple excel file, which automatically did the year-over-year trend comparison and some simple charting. The output was the APPR dashboard. Often this dashboard pointed towards areas that needed my attention and a bit of investigative work.

Today, I have created custom dashboards in salesforce.com that provides real time comparisons for new product launches, after one-year the dashboard changes to a periodic based trend analysis that has taken the place of the APPR dashboard. The important thing is to monitor the product lines you are responsible for and take nothing for granted. This is a good application of the, “productive paranoia” concept that Jim Collins discusses in his book, Great by Choice.

A Happy Ending

So what happened with the product that had the yield issue? After managing a yield of 10% and all the logistical and customer service issues that resulted, for over a year, a new manufacturing process was validated and up and running.   The product was re-launched and regained 96% of it former share dominance.  The product was just that good. The customers allowed us a second bite of the apple.

Since instituting the APPR, have I been shaken from a goodnight sleep by unanticipated product issues?   Of course, the key being unanticipatedunpredictable or random issues.

“Experience is what you get, right after you need it most.”

Make it a great day,

 Tim Walker

 Tim Walker is the Principal consultant for The Experia Group. A small consulting firm that specializes in providing experience and expertise during critical device commercialization phases to increase the probability of success. www.theexperiagroup.com.