The Set Up
Recently I mentioned using a Monte Carlo approach to determining market risk that you should address with your Product Portfolio Plan (PPP). I thought I would take a minute to describe the approach. As a reminder this post deals with only one of three key dimensions of setting your goals for your Portfolio Plan. The PPP should maximize the impact that your new product investment has on your companies performance in the Market.
I developed a tool as a way of garnering agreement with senior management that we were trying to solve the right problem with our Portfolio Planning Process. So that when we started the Portfolio Planning process we had a revenue target, a resource allocation budget and a risk profile projected forward over the 5-8 year period of the Portfolio Plan. The three dimensional aspect of budget, revenue goals and risk profile will help focus your Product Portfolio Plan on the right targets. With out clear targets you can’t optimize the plan. Don’t underestimate the challenge of garnering agreement on the targets.
Einstein indicated that if he were given  an hour to solve a problem he would spend the first 55 minutes making sure he understood the question. Using this methodology will make sure that you understand the question.
The tool is the application of the FMEA methodology into a Monte Carlo method for determining the current assessment of risk in your market, or product segment.
What is a Monte Carlo Approach?
In general, a Monte Carlo approach is used when you have insufficient data to make a definitive decision. But, you need to get started, so you are better off polling the true experts in a field and after their consideration of the issue or problem you accept their consensus recommendation or finding as fact. Validate and adjust your actions from that starting point. Long-term experience suggests that you will be 80% correct, at least this is how I think about it.
A Monte Carlo method is not taking a WAG with three of your buddies. The preferred approach would be to spend a bunch of money, do a ton of research and take several years to figure out your portfolio plan. For companies that are resource constrained or time restricted a Monte Carlo approach, as describe here, is a great first step.
When applying a Monte Carlo approach in determining market risk I have adopted the Failure Modes and Effects Analysis (FMEA) methodology that is used through out the industry in product design. Using a specific and well understood method will help in documenting the process and the findings.
So when applying this method to determine the consensus beliefs about market risks you follow the steps below:
Conducting the Modified FMEA Process
Step 1: Identify industry experts (internal and external to your company)
Step 2: Have them write down the issues that give them pause, cause worry or keep them up late at night, etc.
Issues should be as specific as possible. An example of an issue is: Competitor X will launch their version of your new product Z; x number of months before you.
Step 3: Compile the issues lists and combine where duplicates appear. If you get over a dozen you might want to think about re-writing them to combine a few into a boader category.
Step 4: Create a table that have the Issues listed, any description for clarification purposes and two blank columns titled Impact and Probability of occurance.
Step 5: Assign a 1-5 scale for Impact and a 1-5 scale for Probability of occurance. These scale definitions are critical and a bit tricky to develop.
Step 6: Have the same panel of experts score the issues with the two scales. Each issue is scored 1-5 for impact and 1-5 for probability.
Step 7: Compile the results. Distributions and means. With the issues that have bi-modal distributions you need to go back and have a discussions to ensure that the issues was well defined.
Step 8: Once you have one pair of numbers, impact and probability it is time to plot them on a chart that has impact on the y-axis and the probability of the x axis. Let say that you had 11 major issues identified by your panel of experts. The 11 issues would be plotted as shown below. Note this is an illustration only.
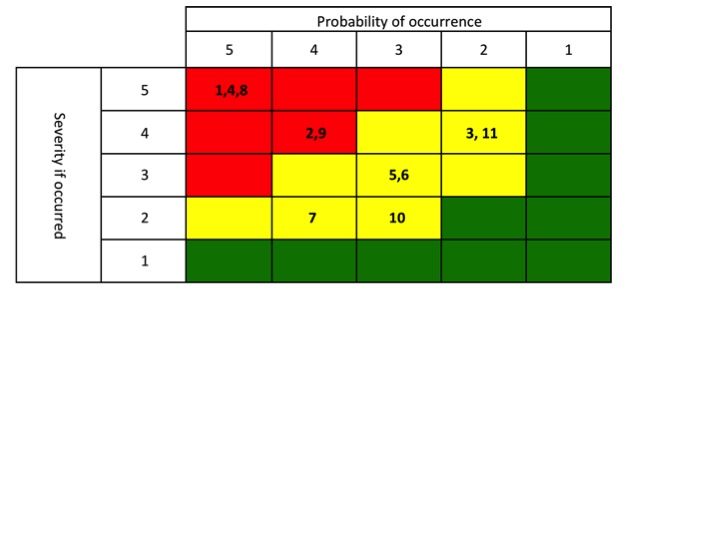
Step 9: This chart will give you your market risk profile. Anything clearly in the red needs to be addressed by some aspect of the Strategic plan and if appropriate the Product Portfolio Plan.
So the three issues that are plotted in the red box, 5 x 5 must be addressed, failure to do so would be catastrophic.
Step 10: Reflect each issue that is in the red, back into the portfolio planning process. This will produce a mitigation plan.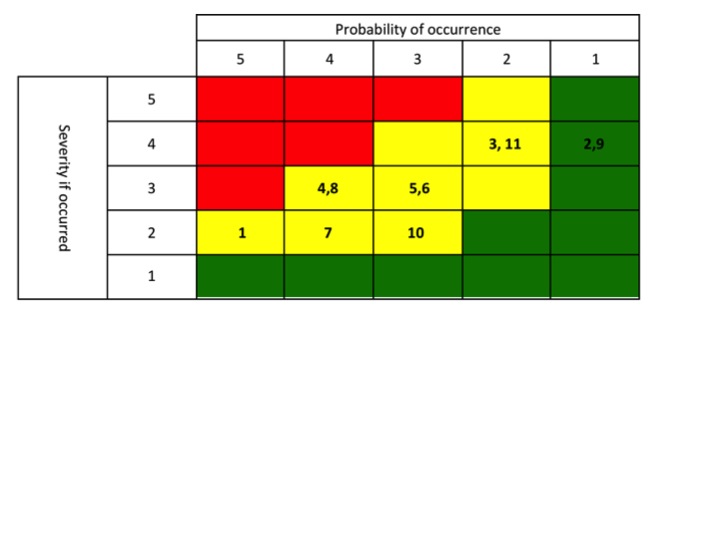
Step 11: Have your expert panel re-score the issues taking into account the mitigations (how you changed the plan or added to it). Plot the new scores. You now have a before and after market risk profile.
Step 12: Once you are satisfied with the new profile, rank the impact that each product program produced. You may have 5-12 product programs that are required to mitigate the risks. Each program could impact multiple risk factors. These impacts should be additive in your prioritization scoring.
Example: Let’s say the issue is an emerging trend toward minimally invasive surgery (MIS) [issue number 2] and you had no products in the pipeline that addressed this emerging trend, currently rated a 4,4 risk score. You added a new product development project to the plan that moved [2] to a 4,1 risk score you have reduced the aggregate risk of this issue by 12 (16-4) a reduction in risk by 12 points. Let say that issue 9 was a lack of product innovation with respect to market leadership. The vision for the MIS project also helped reduce that risk issue as well moving [9] producing a risk reduction of 12 points. When ranking the product dev projects the MIS project would receive 24 risk reduction points.
This ranking will provide one of the three key elements for prioritizing the Portfolio for funding. In the end you will use three ranking scales to rank make your investment decision.
When the portfolio plan is completed you need to make sure you have updated the Market risk profile to reflect the final map based on what was ultimately funded.
Seem complicated? It is at first, once you have done it then you will see the simplicity and logic in it. That is why you must be disciplined in this approach.
Caution: The first time you use this approach do not try to do it alone. There are multiple tricky aspects that might lead you down the wrong road. Call me for one on one coaching or to sign me up to consult you through it.
Make sure you are signed up to receive personal notifications for future post relating to this subject. Download the excel workbook at www.theexperiagroup.com to make your learning a bit easier.
“Experience is what you get, right after you need it most.”
Make it a great day,
Tim Walker
Tim Walker is the Principal consultant for The Experia Group. A small consulting firm that specializes in providing experience and expertise during critical device commercialization phases to increase the probability of success. www.theexperiagroup.com. Contact The Experia Group for a free 30-minute consultation to determine if 30-years of experience can contribute to your success.
© 2016, The Experia Group, LLC