The Set Up
After the series of blog posts relating to portfolio planning it only make sense to take the next step. New Product Requirement planning. This will be a tough series to write. So once again the goal will be to provide an awareness of the process and provide a couple of tips regarding “How To”.
If you gain nothing more than one “aha” out of this series then it was well worth reading.
There are three or four approaches to requirements planning. All of them can work. The process I layout for you here is a straight forward practical approach.
The big caution is reflected in the adjacent cartoon. To avoid the mis-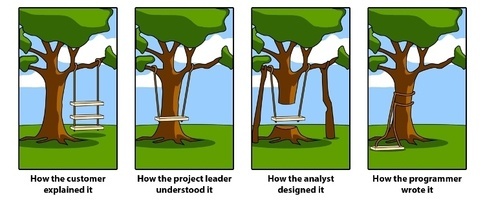 communication take your time creating the Vision statement, Business problem statement, Clinician problem statement and ultimately the initial Product positioning and Value proposition statements.
The High Level Process
Recognize a New Product Opportunity
From the portfolio planning process we have identified that we are vulnerable to collateral share loss in one specific area of our portfolio. Our market scan produced the realization that we don’t have a product in a fast growth segment of the market, perhaps more importantly three of our key competitors do.
Write the Business Problem Statement(s)
Write the problem statement(s) using general language. Note that you may have two or more problem statements. That’s cool. You could write it as a business problem, a portfolio problem, and /or a risk problem. A good start. Eventually you need to write it as a customer problem. Capturing the un-resolved issues that the fast growing segment is resolving.
Conduct a Qualitative Market Scan
Before you write the solution hypothesis you need to gather additional input from the market. At this point in the process I would urge you to collect structured well document qualitative data; don’t skip forward to conducting statistically valid market research just yet. I have spent as little as $25,000 and as much as $1.4 million on market research to determine a winning product definition. It is too big of a financial investment to dive right in without a little background work first.
Now is the time for a little sleuthing, search the MAUDE data base for complaint histories on all three competitive products. Categorize the complaints by type. I typically will capture the categorized data in an excel table. Obtain product specification for each of the three products (sale literature, IFUs from the website, 510k applications, general web search). Next, interview a couple of your top territory managers who have reported competitive activity in their hospitals. Have your sales force poll their accounts to determine who is using this new products. Identify which of your friendly accounts have committed to purchasing the new product (try to interview at least one representative account for each of the three competitive products). Arrange personal one-on-one interviews with each of these committed friendly accounts. The typical product marketing questions should suffice at this point:
- What is/are the challenge(s) you are/were trying to overcome by using this new product?
- How did you try to meet these challenges before you had the new device?
- Why do you believe that this type of product will meet your needs?
- What do you like about the product?
- What don’t you like about the product?
- What type of proof and metrics would you need to see to believe that the product will meet your needs?
- What are important features or attributes of this type of product? (try to get this input prioritized, at least ranked and rated)
- If there was one aspect of the product you could improve what would it be?
Write the Clinical Problem Statement
At this stage the problem statement can be several pages long. In general, the contents of a good problem statement should include:
- A re-statement of the original problem statement that the competitive products were design for,
- The residual un-met needs for each of the three product solutions (gap assessment),
- A summary of the MAUDE database review,
- A summary of claims made in the regulatory filings,
- A summary of warnings and cautions from the IFUs,
- A summary of the clinical trial data if any were required,
- A summary of any editorials or press announcements regarding the products,
- Competitive metrics: share, growth rate, revenue, ASP, archetypal description of customers
Caution: don’t become so focused on the gaps or potential solutions for the gaps that you forget to use fresh eyes on the original problem.
The discovery process that has been described can be done in as little as a couple of weeks or it could take a few months. The creativity comes from you as to how you do the work economically or efficiently. Just don’t skip this step.
Now you have enough information to define the problem. This will be the vision statement for your R&D team as well as management. A problem statement post will also be a part of this series.
Quantitative Market Research
Hopefully, your vision statement / problem statement has been compelling enough to warrant a further investment by Sr. management to execute a formal VOC process that will include additional qualitative and your initial quantitative research.
I will go into great detail is a subsequent post regarding how to do the quantitative research. For now lets focus on the output. For me the most effective way to look at the output of the initial quantitative research is in a stacked spider /radar chart. A spider/radar chart produces a geometric picture of the shape of possible solution sets for the un-met needs.
Description of a Radar/Spider Chart
Each of the axis of a radar chart represents a benefit/feature/attribute of the solution set. These are the most critical aspects of the product to the customer.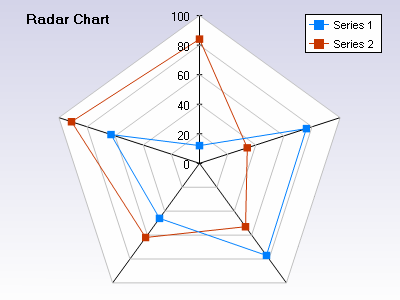 The scores are a reflection of how well the product meets their needs. The scale is arbitrary, I typically will use 0-10. The end product in this scenario would have five (5) separate geometric plots.
- The ideal or perfect scores for the general market
- The ideal or perfect set of scores for your chosen segment
- Competitor 1 scores
- Competitor 2 scores
- Competitor 3 scores
In the example provided you can see that the two series of data have markedly different shapes. The ideal solution for this general population would be the connecting of all the highest scores of each axis. This would provide you with a third geometric shape. By looking at the differences between the first two series and the newly created third one you get a feeling for the gaps. You can plainly see that the red series has a biased solution that delivers on the left axis and the blue to the right. Knowing this and combining it with the balance of what you learned from your competitive analysis you can determine what your new product strategy could be. There will be several biases that you can select from.
The big watch out here is to use the qualitative research to make sure your axis are the critical ones for success of your new solution. Your ultimately success with this new product will be directly linked to how well you determine the critical success factors or axis to plot.
“Experience is what you get, right after you need it most.”
Make it a great day,
Tim Walker
Tim Walker is the Principal consultant for The Experia Group. A small consulting firm that specializes in providing experience and expertise during critical device commercialization phases to increase the probability of success. www.theexperiagroup.com. Contact The Experia Group for a free 30-minute consultation to determine if 30-years of experience can contribute to your success.
© 2017, The Experia Group, LLC